



About this course booklet
The mitochondrial membrane potential (ΔΨm) is not a static number, but a dynamic balance between proton pumping by the electron transport chain and multiple discharge pathways including ATP synthesis, ion transport, and leak in mitochondrial dysfunction.
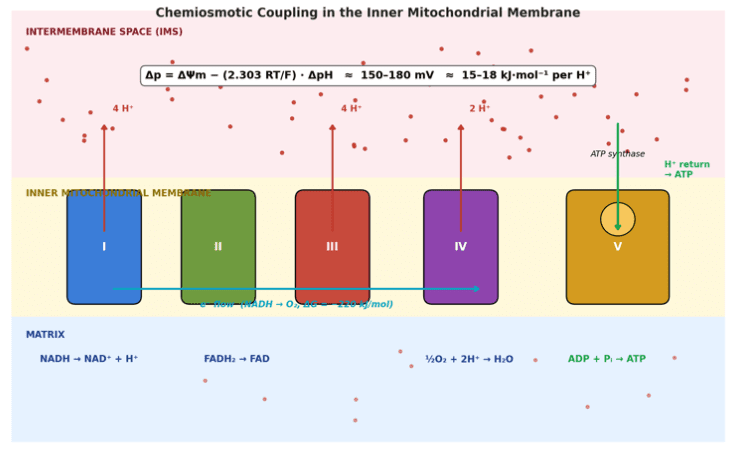
Under physiological conditions, ΔΨm is maintained around 150–180 mV, contributing to a total proton motive force (Δp) of ~180–220 mV. This electrochemical gradient captures a large fraction of the ~−220 kJ·mol⁻¹ released by NADH oxidation and powers ATP synthesis, metabolism, and signaling.
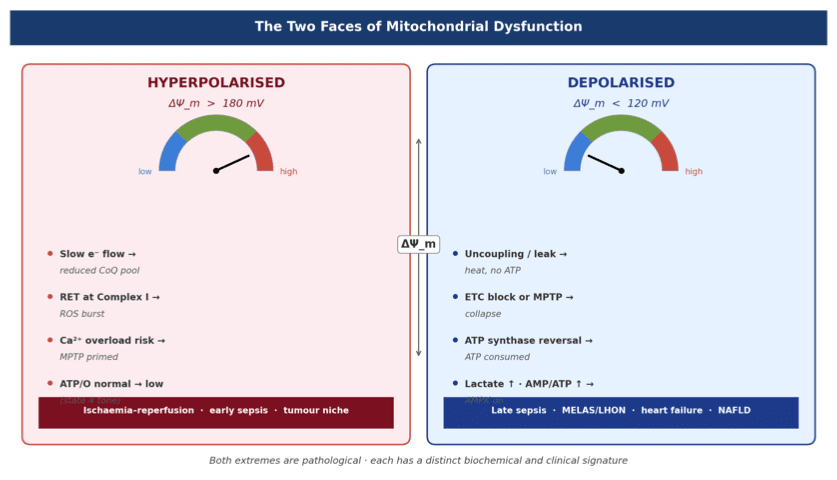
This 15-page course booklet provides a structured and clinically actionable framework to understand mitochondrial dysfunction as a bifurcation between two opposite states:
- Hyperpolarisation (ΔΨm > 180 mV): ROS-driven, high-energy but unstable
- Depolarisation (ΔΨm < 120 mV): energy failure, ATP deficit, collapse
Understanding this distinction is essential, as each state requires opposite therapeutic strategies.
Inside the booklet (4 chapters)
Chapter 1 — What creates and raises ΔΨm
Five levers, in order of quantitative weight:
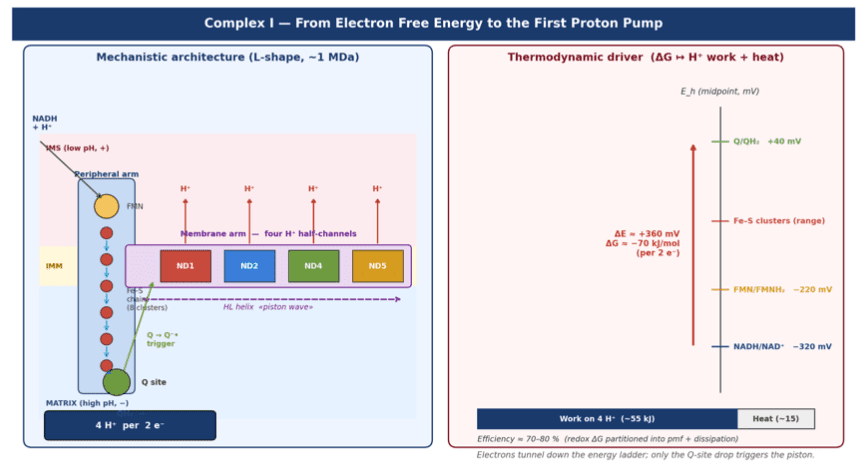
- Vectorial H⁺ pumping by Complexes I (4 H⁺), III (4 H⁺), IV (2 H⁺) per 2 e⁻ = 10 H⁺/NADH.
- Substrate supply — TCA, β-oxidation, glutaminolysis, ketone bodies, malate–aspartate / glycerol-3-P shuttles.
- Decreased discharge — low ADP / Pi, ANT or F_O inhibition → State 4 respiration → physiological hyperpolarisation.
- Reduced leak — UCP down-regulation, cardiolipin integrity, tight cristae (MICOS/OPA1), supercomplex assembly.
- Cation/H⁺ fine-tuning — K_ATP closure, Na⁺/H⁺ antiporter balance, physiological matrix Ca²⁺ activating PDH and 3 dehydrogenases.
Thermodynamic ceiling set by ΔG_phos ≈ −56 to −60 kJ·mol⁻¹ and n ≈ 2.7 H⁺/ATP → max sustainable Δp ≈ 200–230 mV. Healthy mitochondria hover at a “soft ceiling” ~180 mV because leak becomes non-ohmic above this.
Clinical hyperpolarised contexts: ischaemia–reperfusion (RET ROS burst), tumour cells (supranormal ΔΨm, mitocan-sensitive), early sepsis, effector T-cell priming.
Chapter 2 — What decreases ΔΨm
Five categories:
- A. ETC inhibition — rotenone/MPP⁺/LHON (I), 3-NP/SDHx (II), antimycin A (III), CO/CN/NO-sepsis (IV), cyt c loss.
- B. Substrate/cofactor deprivation — hypoxia, TCA stalls, β-oxidation failures (CPT-II, MCAD, VLCAD), CoQ₁₀ deficiency, Fe–S cluster defects (Friedreich).
- C. Increased leak — DNP/FCCP, UCP1-3, fatty-acid cycling, ANT leak, cardiolipin peroxidation.
- D. MPTP opening — Ca²⁺ overload + oxidative stress, cyclosporin-A-sensitive, catastrophic collapse.
- E. ATP synthase reversal — IF₁-regulated; consumes glycolytic ATP to hold residual ΔΨm.
Feed-forward depolarisation loop: ΔΨm ↓ → PINK1/Parkin mitophagy, Ca²⁺ release, AMPK activation, ROS burst, cyt c release, deeper ΔΨm loss.
Clinical depolarised contexts: late sepsis (cytopathic hypoxia), heart failure, neurodegeneration, MELAS/LHON/Leigh, mitotoxic drugs (metformin, NRTIs, linezolid, valproate), NAFLD/NASH.
Immunometabolic consequence: macrophage lock into M1/HIF-1α; T-cell effector→memory transition fails; sepsis immunoparalysis.
Therapeutic hierarchy (5 tiers): remove insult → replenish substrates/cofactors → buffer redox → enhance mitophagy → experimental (elamipretide, NAD⁺ repletion, gene therapy).
Chapter 3 — Clinical distinction hyper- vs hypo-ΔΨm
Biochemical fingerprint (10 axes) — ETC flux, NADH/NAD⁺, CoQ redox, ROS, ATP/ADP, lactate, Ca²⁺ handling, PINK1/Parkin, morphology, heat output.
Four-step workup:
- Clinical baseline — lactate, L/P ratio (>25 → Complex I/ETC block), β-OHB/AcAc, acylcarnitines.
- Functional — Seahorse OCR, JC-1/TMRM imaging, muscle biopsy enzymology.
- Genotype — mtDNA sequencing with heteroplasmy, nuclear panel, MR spectroscopy lactate peak.
- Directional fingerprint — synthesis at bedside.
Rule of thumb:
- High ROS + normal ATP + reperfusion context → hyperpolarised dysfunction.
- High lactate + low ATP + AMPK on + mitophagy markers + chronic illness → depolarised dysfunction.
Therapeutic directionality (key insight): antioxidants and mild uncouplers protect hyperpolarised but harm depolarised; substrate/cofactor repletion and mitophagy enhancers rescue depolarised but not hyperpolarised; lipophilic cationic mitocans are selectively cytotoxic only to hyperpolarised tumour mitochondria (exp(FΔΨm/RT) accumulation law).
Chapter 4 — Integrative synthesis
- ΔΨm × ROS × redox triangle phase-space map of bioenergetic states.
- Bedside decision tree (5 Qs).
- Memorisable quantitative anchors: resting ΔΨm 150–180 mV, Δp 180–220 mV, 2.303RT/F ≈ 61.5 mV/pH, stoichiometries, ΔG anchors, pathological thresholds.
Appendices
- A. Key equations: Δp, ΔG° = −nFΔE°, ΔG_phos, Nernst accumulation, P/O ratio. Physical constants.
- B. 16-entry glossary covering ΔΨm, Δp, ETC, RET, MPTP, ANT, MCU, UCP, PINK1/Parkin, cardiolipin, JC-1/TMRM, L/P ratio, β-OHB/AcAc, State 3/4, mitocan, IF₁.
Who is this for?
- PhD students in bioenergetics and physiology
- Medical doctors and clinicians
- Researchers in metabolism and immunology
- Professionals interested in mitochondrial medicine
Key insight
ΔΨm is not simply “high or low” — it defines two opposite pathological regimes, each requiring fundamentally different therapeutic strategies.
Note: The full PDF is in English.